Imun Farmer · Published:
- 예상 수확: 6 min read
Solar Power as a Side Business: A Deep-Dive ROI Analysis
Solar Power as a Side Business: A Deep-Dive ROI Analysis

Every conversation about side income eventually lands on solar. “Just install it and watch the money roll in” — that’s half true. The passive part is real; the “just install and forget” part needs a reality check. This report breaks down the actual numbers for anyone considering a solar side business in South Korea in 2026.
Understanding the Revenue Structure
Solar income in Korea is driven by exactly two variables: SMP (System Marginal Price) and REC (Renewable Energy Certificate).
SMP is the wholesale electricity price — the rate at which solar operators sell power to KEPCO. As of May 2026, mainland SMP averages 113.80 KRW/kWh, trading in a 110–120 KRW range through 2025–2026.
REC is a certificate issued for each MWh of renewable energy produced. It’s traded separately on the power exchange. The average REC price as of May 2026 is 70,100 KRW/REC (approximately 70.1 KRW/kWh when converted).
Total revenue per kWh = SMP + (REC price × weighting factor). The weighting factor varies by installation type.
| Installation Type | REC Weight | Notes |
|---|---|---|
| Building rooftop (<100kW) | 1.5–1.6 | Best for side businesses |
| Building rooftop (≥100kW) | 1.0–1.2 | Weight drops with scale |
| Open land (small scale) | 0.8–1.0 | Requires separate land acquisition |
| Forested/mountain land | 0.5 | Slashed in 2021 due to environmental concerns |
| Floating solar (<100kW) | 1.6 | High permitting difficulty |
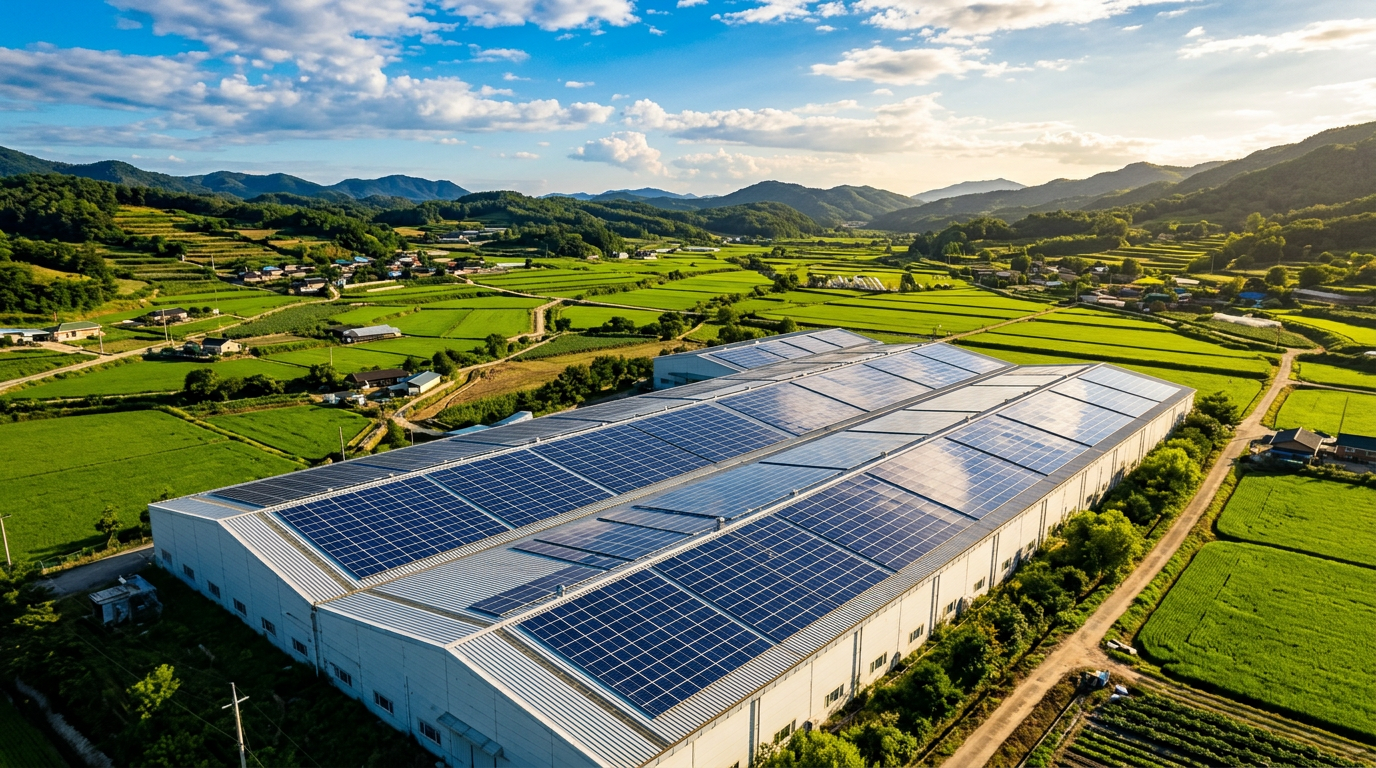
| Livestock/farm facility roof | 1.5 | Optimal for rural side businesses |
Revenue Simulation — 100kW Scale
The 100kW system is the standard entry point for side-business solar. It fits on a warehouse or livestock barn roof and can be managed without hiring full-time staff.
Using current 2026 figures:
- Annual generation: 100kW × 3.6 hrs/day × 365 days = 131,400 kWh
- SMP revenue: 131,400 × 113.80 KRW = approx. 14.95M KRW
- REC revenue (weight 1.5): 131.4 RECs × 70,100 × 1.5 = approx. 13.82M KRW
- Total annual revenue: approx. 28.77M KRW (~240M KRW/month)
Real-world confirmation: A livestock facility operator running a 152kW system reported total 2025 revenue of 43.32M KRW — equivalent to roughly 240–260K KRW/month on a 100kW basis after scaling.
Monthly operating costs to subtract:
| Cost Item | Monthly Amount |
|---|---|
| Safety manager (outsourced) | ~100,000–150,000 KRW |
| Inverter & maintenance | ~50,000–100,000 KRW |
| Insurance | ~20,000–30,000 KRW |
| Miscellaneous | ~30,000–50,000 KRW |
| Total | ~200,000–330,000 KRW/month |
Net monthly income: approximately 1.7M–2.1M KRW.
Initial Investment and Payback Period
A 100kW rooftop installation costs roughly 110M–150M KRW total, depending on location and structural conditions.
Government financing is the key lever. Under the 2026 Renewable Energy Financial Support Program, individual operators (small business classification) can receive government-backed low-interest loans covering up to 80% of project costs. Starting in 2026, eligible lenders expanded to include local agricultural cooperatives, fisheries cooperatives, credit unions, and community banks.
Practical implication: a 130M KRW project requires only about 26M KRW in personal capital when using maximum financing.
| Scenario | Payback Period |
|---|---|
| Full self-funding | 5–7 years |
| 80% government financing | 3–4 years (on own capital) |
| 20-year total net profit | Several hundred million KRW |
A documented real case: a 210M KRW investment generating 41.76M KRW annually hit exact 5-year payback — and this was a normal outcome, not an outlier.
Three Side Business Models
Model 1 — Direct Power Generation (Own Building Rooftop)
Highest profitability. If you have a warehouse, barn, or factory roof, you receive 1.5× REC weighting without land acquisition costs. Net monthly income of 2M+ KRW is achievable. Requires handling permitting yourself and front-loading capital.
Model 2 — Roof Lease (Zero-Investment Model)
Lease your rooftop to a solar operator. Zero upfront cost, zero management burden. For 1MW scale, this generates roughly 30M KRW/year in rental income. For 100kW, expect 2–3M KRW/year. Lower return, but genuinely hands-off. Ideal for building owners who want passive income with minimal involvement.
Model 3 — Agricultural/Rural Land Installation
Relevant if you own farmland. Using agricultural facility roofs maintains the 1.5× REC weight. Open-field or forest installation faces significantly lower weights (0.5–0.8) and heavier permitting hurdles. Only viable if existing agricultural structures are available on-site.
Tax Treatment for Employed Workers
Salaried employees running solar as a side business file comprehensive income tax. The surprise: the actual tax burden is remarkably low.
For annual solar revenue of 28M–36M KRW, the simplified expense rate of 95.1% applies — meaning 95.1% of gross revenue is recognized as deductible expenses. Taxable income is only approximately 5% of revenue.
At 36M KRW gross revenue, estimated income tax runs 100,000–200,000 KRW per year for a solo household. Even combined with employment income, the marginal tax from the solar side business is typically a few hundred thousand KRW — not a material concern.
VAT: electricity sales to KEPCO are subject to VAT. Input VAT paid at installation is fully refundable, and thereafter VAT is handled on a net basis with quarterly filings.
Real Risks in the Current Market
Output Curtailment (출력제어)
The most critical near-term risk. Grid congestion — especially in the Honam (Jeonnam/Jeonbuk) region — has caused compulsory shutdown of operating plants. In 2024, Honam saw 26 curtailment events totaling 7,473MW of capacity. The 2026 spring grid management period ran a record 107 days (February–June). Plants generate nothing during curtailment periods.
As of mid-2026, Honam and Jeju are effectively closed to new renewable grid connections due to transmission saturation. If you’re in Honam, check grid capacity before anything else.
SMP and REC Price Decline
Both SMP and REC trended downward in 2025. Experts warn that if oversupply continues, REC could drop to the low-60 KRW range. Since solar is a 20-year business, pricing assumptions must include downside scenarios.
Permitting Timeline
Full permitting runs 6–10 months on average: power business permit → land development permit → grid connection contract → construction notice → pre-use inspection → PPA → REC registration. Plan for this before budgeting cash flow.
Setback Regulation
Local ordinances governing distance from residential zones have varied by municipality. A 2026 legislative revision is expected to standardize rules, with exemptions for rooftop and building-integrated systems. Sticking to rooftop installations largely sidesteps this issue.
Investment Decision Framework
| Parameter | Detail |
|---|---|
| Minimum personal capital | ~25–30M KRW with 80% financing |
| Expected annual revenue (100kW) | 24M–32M KRW (varies by weight/location) |
| Payback period | 5–7 years full funding; 3–4 years on own capital |
| Annual tax burden | ~100,000–200,000 KRW (solar income only) |
| Management time | 2–4 hrs/month with outsourced maintenance |
| Key risks | SMP/REC volatility, curtailment, permitting delay |
| Favorable conditions | Existing building roof, non-Honam region, high solar exposure |
Three-Line Summary
- A 100kW rooftop system generates ~1.7–2.1M KRW/month net, with full payback in 5–7 years (or 3–4 years using government financing).
- Government loans cover up to 80% of costs, and tax treatment under the simplified expense rate makes solar side income virtually tax-neutral for most salaried employees.
- Honam-region curtailment and falling REC prices are the primary structural risks — operators with existing building rooftops in non-Honam regions have the most favorable economics.
References
- Korea New and Renewable Energy Center (KNREC), “2026 Renewable Energy Financial Support Program Notice,” March 2026. https://www.knrec.or.kr/biz/pds/businoti/view.do?no=6364
- Haezoom, “2026 Solar Business Guide: Installation Costs, Subsidies, Revenue Structure,” January 2026. https://blog.haezoom.com/insightrps11/
- Haezoom, “2026 Solar Installation Revenue Analysis Based on REC/SMP Trends,” January 2026. https://blog.haezoom.com/insightrps09/
- Haezoom, “2025 Solar Power Business Year-End Review & 2026 Outlook,” December 2025. https://blog.naver.com/haezoom/224118253766
- Iaansolar, “2026-05-26 SMP & REC Price Summary,” May 2026. https://iaansolar.tistory.com/
- LS Energy, “2026 Solar SMP/REC Price Trends and Market News,” April 2026. https://lsenergy.tistory.com/
- Windsun, “100kW Solar Business Cost and Revenue Analysis,” April 2025. https://www.windsun.kr/6
- Solarconnect, “100kW Solar Business Taxes (ft. Simplified Expense Rate),” August 2023. https://blog.naver.com/solarconnect/223199208293
- Enlighten, “Government Announces REC Weighting Adjustment for New Renewable Energy Equipment.” https://www.enlighten.kr/insight/biz-development/6150
- Agricultural News (Nongmin Shinmun), “Can Livestock Barn Rooftop Solar Become a New Farm Revenue Source?” November 2025. https://v.daum.net/v/20251107050103538
- Korea Rural Economic Institute, “Profitability and Risk Analysis of Solar Power Projects.” https://repository.krei.re.kr/bitstream/2018.oak/24546/1/RE42-4-06.pdf
- Haezoom, “Output Curtailment Explained: What It Means for Solar Revenue,” 2026. https://blog.haezoom.com/insightvpp36/
- Solutions for Our Climate, “100GW Renewable Energy — Not Like This: Grid Saturation Crisis,” May 2026. https://forourclimate.org/ko/newsroom/1173
- Jipyong Law Firm, “Key Provisions of the Amended Electricity Business Act,” September 2020. https://www.jipyong.com/kr/board/news_view.php?seq=9645
Contribution to this Harvest
내용이 유익했다면 물을 주어 글을 성장시켜주세요!
(0개의 물방울이 모였습니다)