Imun Farmer · Published:
- 예상 수확: 7 min read
Agrivoltaic Solar Profitability Calculator (2026 Korea Edition)
Agrivoltaic Solar Profitability Calculator (2026 Korea Edition)
How much do you actually make when you put solar panels over a rice paddy? Let’s get into the numbers.
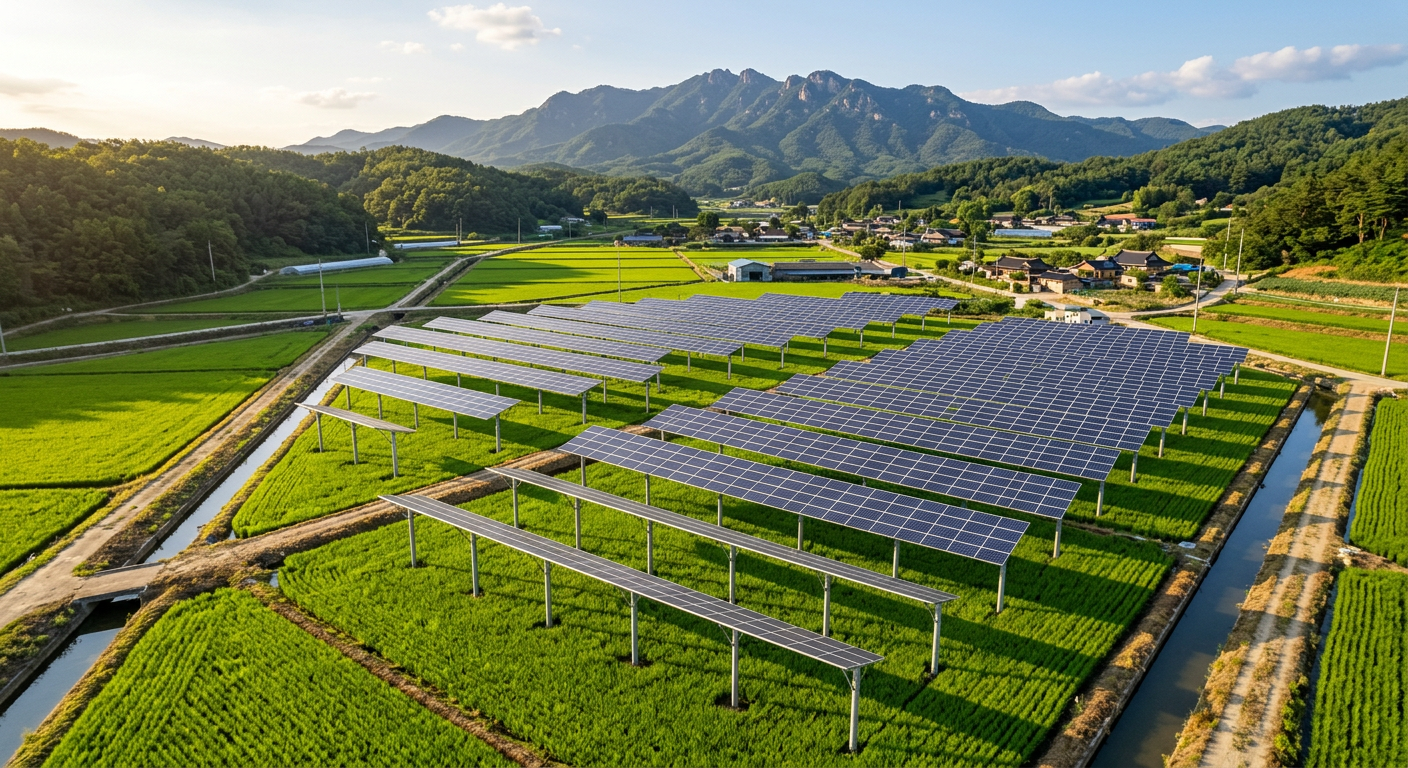
What Is Agrivoltaics?
Agrivoltaics (영농형 태양광, yeongnonghyeong taeyangwang) refers to the dual use of agricultural land for both crop cultivation and solar power generation. Panels are mounted 3–5 meters above the ground on tall structural frames, allowing approximately 70% of sunlight to reach the crops while the remaining 30% is captured for power generation.
South Korea introduced the concept in 2016, and as of late 2025, approximately 90 demonstration projects are actively operating nationwide. The model addresses two concurrent rural crises: the collapse of farm household income and the national push toward carbon neutrality by 2050.
Key Terms Explained
CAPEX (Capital Expenditure)
The one-time upfront investment required to build the installation. This includes modules, inverters, structural framing (poles and rails), electrical wiring, grid connection fees, and administrative/permitting costs.
2026 Agrivoltaic CAPEX Benchmarks:
| Capacity | Cost per kW | Total Investment | Notes |
|---|---|---|---|
| 100 kW | ~1,371–1,777 KRW/kW | ~140–178 million KRW | Farmland-owned basis |
| 1 MW | ~1,590 KRW/kW | ~1.59 billion KRW | ~12% economies-of-scale reduction |
Agrivoltaic installations cost approximately 1.5x more than conventional rooftop or ground-mount solar due to the elevated structure requirements for agricultural machinery access.
OPEX (Operational Expenditure)
Annual recurring costs to keep the system running: labor, inspection and maintenance, insurance, meter rental, and administrative overhead.
Annual OPEX Reference Values:
| Capacity | Per-kW Annual Cost | Total Annual Cost |
|---|---|---|
| 100 kW | ~30,510 KRW/kW-yr | ~3.05 million KRW |
| 1 MW | ~23,114 KRW/kW-yr | ~23.11 million KRW |
OPEX grows annually with inflation (assumed 1.62%). Inverter replacement is required every 10 years and should be budgeted as a recurring CAPEX event. Panel output degrades at 0.54% per year.
SMP (System Marginal Price, 계통한계가격)
The wholesale electricity price that generators receive when selling power into the national grid. SMP fluctuates hourly based on power supply-demand dynamics and fuel input costs (primarily LNG).
Recent SMP Trend (Mainland Korea):
| Period | Average SMP (KRW/kWh) |
|---|---|
| September 2025 | 111.85 |
| December 2025 | 89.77 (seasonal dip) |
| January 20, 2026 | 109.11 |
| January 30, 2026 | 111.79 |
| March 2026 | 109.79 |
Annual SMP averages in the range of 100–115 KRW/kWh under current market conditions.
REC (Renewable Energy Certificate, 신재생에너지 공급인증서)
Generating 1 MWh (= 1,000 kWh) of solar power earns one REC. These certificates are sold to obligated power suppliers under Korea’s Renewable Portfolio Standard (RPS) system, providing a second revenue stream on top of SMP.
1 REC = 1 MWh. At 70,000 KRW/REC, this translates to 70 KRW/kWh of additional revenue.
Recent REC Price Data (Mainland Korea):
| Period | REC Price (KRW/REC) | kWh Equivalent |
|---|---|---|
| September 2025 | 71,997 | ~72.0 KRW/kWh |
| 2025 Annual Average | 70,000–80,000 | 70–80 KRW/kWh |
| January 2026 | 71,700 | ~71.7 KRW/kWh |
| March 2026 | 70,356 | ~70.4 KRW/kWh |
REC Multipliers
The RPS system applies multipliers to REC issuance based on installation type and scale. Agrivoltaics currently does not have a dedicated multiplier and follows the standard ground-mount schedule.
| Capacity | REC Multiplier | Notes |
|---|---|---|
| < 100 kW | 1.2 | Small-scale premium |
| 100 kW – 3,000 kW | 1.0 | Standard |
| > 3,000 kW | 0.8 | Large-scale penalty |
| Community-based (≥500 kW) | Base + up to 0.2 | Cooperative/resident participation |
Advocacy groups continue to push for a dedicated agrivoltaic multiplier, but as of April 2026, no separate multiplier has been implemented.
Self-Consumption Revenue Split
Self-consumption means using generated electricity on-site (farmhouse, smart farm, cold storage) rather than selling it to the grid. Revenue is realized as electricity bill savings instead of direct cash receipts.
Decision rule: If utility electricity tariff > SMP → self-consumption is more valuable. If tariff < SMP → grid export is more valuable. Well-designed agrivoltaic systems integrated with smart farms have demonstrated electricity bill reductions exceeding 70% per month.
Revenue Formula and Sample Calculation
Base Revenue Formula
Annual Generation Revenue = Annual Output (kWh) × (SMP (KRW/kWh) + [REC Price (KRW/REC) ÷ 1,000 × Multiplier])
100 kW System — March 2026 Spot Prices:
- Capacity utilization rate: 15.38%
- Annual output: 100 kW × 8,760 hrs × 15.38% ≈ 134,729 kWh
- SMP: 109.79 KRW/kWh
- REC multiplier 1.2: 70,356 ÷ 1,000 × 1.2 = 84.43 KRW/kWh
- Combined rate: 109.79 + 84.43 = 194.22 KRW/kWh
- Gross annual revenue: 134,729 × 194.22 ≈ 26.17 million KRW
- Annual OPEX: 3.05 million KRW
- Net annual generation income: ~23.1 million KRW
A real-world site (August 2025 benchmark, 100 kW) reported approximately 26.6 million KRW annual revenue (~2.21 million KRW/month).
Parallel Agricultural Income
Jeonnam Yeongam County pilot (November 2024 – October 2025, ~2,310 m² paddy):
- Solar generation revenue (estimated): 8.97 million KRW
- Rice harvest shortfall (21% yield reduction): -250,000 KRW
- Net income increase: 8.72 million KRW
- Compared to rice-only farming on the same plot: 8.4× total revenue
Note: This pilot figure excludes installation costs. Meaningful income improvement at farm level begins approximately 7 years post-installation.
Scenario Analysis (100 kW, 20-Year Operation)
Based on Korea Energy Economics Institute (KEEI) academic analysis, 2024.
Scenario A: 100% Equity Financing
| Scenario | Operating Term | NPV (mil. KRW) | B/C Ratio | IRR |
|---|---|---|---|---|
| Current Farmland Act (8 years) | 8 yrs | -58.4 | 0.71 | -3.3% |
| Reference Case (20 years) | 20 yrs | +29.5 | 1.12 | 6.5% |
| Extended (30 years) | 30 yrs | +66.9 | 1.25 | 7.9% |
An 8-year operating term produces a negative NPV under all conditions. A minimum of 20 years is required for economic viability.
Scenario B: 90% Debt Financing at 2.25% Interest
| Scenario | Operating Term | NPV (mil. KRW) | B/C Ratio | IRR |
|---|---|---|---|---|
| Current Farmland Act (8 years) | 8 yrs | -33.0 | 0.81 | 13.0% |
| Reference Case (20 years) | 20 yrs | +61.2 | 1.29 | 75.0% |
| Extended (30 years) | 30 yrs | +98.6 | 1.42 | 75.0% |
Leveraged financing doubles the NPV versus all-equity when the borrowing rate (2.25%) stays below the discount rate (4.5%).
Sensitivity Analysis
1. SMP + REC Price Sensitivity (100 kW, 20-Year)
| Price Scenario | NPV — Equity (mil.) | NPV — Financed (mil.) | B/C (Financed) |
|---|---|---|---|
| +10% increase | 54.1 | 85.8 | 1.40 |
| Base case | 29.5 | 61.2 | 1.29 |
| -10% decrease | 4.9 | 36.6 | 1.18 |
Every 10% movement in SMP+REC prices shifts NPV by approximately 24.6 million KRW in either direction. This is the single largest sensitivity driver.
2. Operating Term (Permit Duration) Sensitivity
| Permit Term | NPV — Equity (mil.) | Economic Verdict |
|---|---|---|
| 8 years | -58.4 | Not viable |
| 20 years | +29.5 | Minimum threshold |
| 23 years (target) | ~+45 (est.) | Target under 2026 law |
| 30 years | +66.9 | Optimal |
Each additional year of operation adds approximately 3–4 million KRW in NPV. Regulatory change is a direct profitability lever.
3. Financing Condition Sensitivity (100 kW, 20-Year)
| Condition | NPV (mil. KRW) | B/C |
|---|---|---|
| Base (2.25% rate, 5-yr grace) | 61.2 | 1.29 |
| No grace period | 47.4 | 1.21 |
| Rate raised to 4.5% | 33.8 | 1.14 |
| 4.5% rate + 70% LTV | 32.9 | 1.14 |
Doubling the interest rate (2.25% → 4.5%) erodes NPV by 27.4 million KRW. Access to subsidized policy financing is critical.
4. Scale-Up Sensitivity (1 MW, Financed)
| Scenario | NPV (mil. KRW) | B/C |
|---|---|---|
| 1 MW — 20-year base | 751.6 | 1.41 |
| 1 MW — 30-year | 1,149.3 | 1.57 |
| 1 MW — Community (+0.2 REC) | 894.3 | 1.49 |
Scaling to 1 MW yields an NPV more than 10× larger than 100 kW, driven by economies of scale reducing per-kW CAPEX and OPEX.
2026 Regulatory Changes and Profitability Impact
The most consequential policy development for 2026 is the push to extend the farmland temporary use permit from 8 to 23 years. At the Second Core Regulatory Reform Strategy Meeting (October 16, 2025), the government announced:
- Permit term extended: 8 years → 23 years (structured as 8 + 5 + 5 + 5 years)
- Renewable Energy Zones permitted within agricultural promotion areas
- Village cooperatives and regional legal entities eligible as project operators
- Structural standards codified: 2.5m minimum height, 3m column spacing, ≤30% module area coverage
Energy Act amendments targeted for completion by end of 2025; Farmland Act amendments targeted for H1 2026. As of April 2026, parliamentary subcommittee deliberations continue.
The 23-year term improvement alone is estimated to lift NPV by approximately 15 million KRW (equity basis), transforming marginal projects into economically sound investments.
Payback Period Summary
| Conditions | Payback Period |
|---|---|
| 100 kW, all equity, spot market | ~14–15 years |
| 100 kW, 90% financed, low rate | ~7–10 years |
| 1 MW, financed | ~7–9 years |
| Pilot evidence (Yeongam, Jeonnam) | Meaningful income shift after year 7 |
Investment Checklist
Before running any profitability model, these variables must be fixed:
- Capacity (kW): Derive from available land area and shading analysis
- Net installed cost (KRW/kW): Vendor quotes minus subsidies and policy loans
- Annual output (kWh/yr): Regional solar irradiance × capacity × utilization factor (~15–16%)
- Revenue rate: SMP + (REC × multiplier) — spot market vs. fixed-price contract
- Operating term: Currently 8 years; anticipate 23 years pending legislation
- Financing structure: Equity ratio, interest rate, grace period
- Discount rate: Social rate 4.5% or individual hurdle rate
- Self-consumption allocation: Factor in electricity bill savings for smart farm or cold storage loads
References
| # | Source | Publisher |
|---|---|---|
| 1 | Policy Directions to Enhance Economic Feasibility of Agrivoltaics in Korea (2024) | Korea Energy Economics Institute, New & Renewable Energy journal |
| 2 | Mid-to-Long-Term LCOE Forecast for Renewable Energy Expansion (2025) | Korea Energy Economics Institute |
| 3 | The Future of Agrivoltaic Projects in Korea (2023) | Korea Rural Economic Institute (KREI) |
| 4 | March 2026 Solar SMP/REC Price Trends | Haezoom Blog |
| 5 | January 2026 SMP·REC Daily Price Report | Iaan Solar Blog |
| 6 | Agrivoltaics: 2026 Outlook | Gekko System |
| 7 | Agrivoltaic Demonstration Revenue 8× Higher Than Rice-Only Farming (2025.11) | Korea Energy Service / HaizonTV |
| 8 | 7 Things to Check Before Installing Agrivoltaics (2026) | IMUN Farm |
| 9 | Profitability Analysis of Rural Fence-Type Solar Projects (2025) | New & Renewable Energy journal |
| 10 | Government Policy and Recent Trends in Agrivoltaics (2026.02) | Cheongbuk Innovation City Forum |
| 11 | Agrivoltaic Farmland Use Period: 8→23 Years | Hanbit Energy, 2026 |
All profitability figures in this document are based on 2024–2026 pilot, academic, and market data. Actual results will vary based on site-specific solar irradiance, power market conditions, interest rates, and regulatory implementation timing.
Contribution to this Harvest
내용이 유익했다면 물을 주어 글을 성장시켜주세요!
(0개의 물방울이 모였습니다)