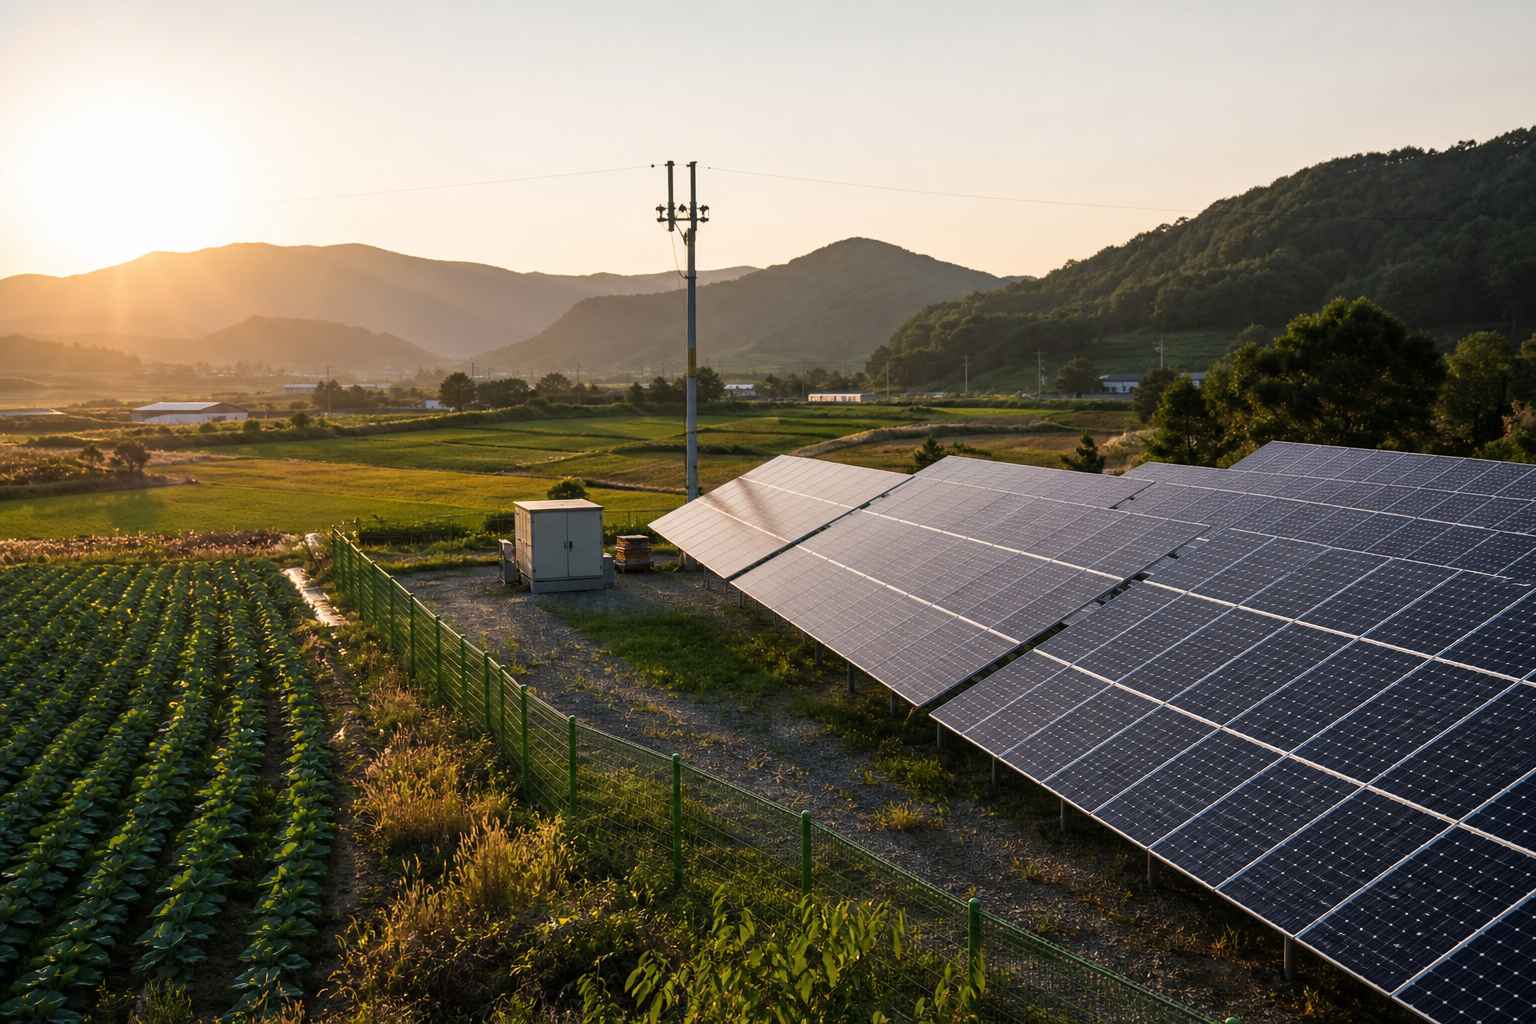
A practical 100kW farmland solar profit calculation using generation, SMP, REC, operating costs, installation cost, payback period, permits, and cash flow.
Farmland Solar Profit: How Much Does a 100kW System Make Per Month?
If solar panels go on farmland, how much money lands in the bank each month. That is the question people search for first. Not policy language. Not energy-transition theory. Just the number.
Some say a 100kW solar plant makes around 2 million KRW per month. Others say little remains after loans and costs. Both can be true. The result depends on the SMP price, REC price, REC weighting, generation, operating cost, debt, taxes, land cost, and grid-connection cost.
This article calculates a 100kW farmland solar case. The basic formula is simple. Multiply generation by SMP and REC, then subtract operating costs. But farmland adds another layer: permits, land category, grid access, and restoration or conversion issues. A monthly-profit number without those conditions is only half a calculation.
Here is the short version. With conservative assumptions, a 100kW system produces about 1.73 million KRW in monthly gross revenue and about 1.48 million KRW in monthly net income after basic operating cost. With a mid-case assumption, monthly gross revenue is about 2.00 million KRW and monthly net income is about 1.75 million KRW. Loan payments, taxes, and land rent still need to be subtracted.
The assumptions used here
Solar revenue usually comes from two sources. The first is SMP revenue from selling electricity. The second is REC revenue from renewable energy certificates. This is the basic revenue structure described in Korean power-market and renewable-energy materials.
This calculation uses the following assumptions.
- Installed capacity: 100kW.
- Annual generation: 130,000kWh.
- Monthly average generation: about 10,833kWh.
- Conservative SMP: 90 KRW/kWh.
- Conservative REC: 70,000 KRW/MWh.
- REC weighting: 1.0.
- Annual operating cost: 3 million KRW.
The annual generation assumption means 1,300kWh per kW per year. Actual generation changes by region, direction, tilt, shade, construction quality, downtime, snow, dust, and maintenance. A clean south-facing site can produce more. A site with mountain shade, pole shade, or poor orientation can produce less. Solar is still farming in one sense. The crop is sunlight.
How the monthly revenue is calculated
Start with the conservative case. Annual generation is 130,000kWh. At 90 KRW/kWh SMP, electricity-sales revenue is 11.7 million KRW per year. REC revenue is 130MWh × 70,000 KRW × 1.0, or 9.1 million KRW per year.
Annual gross revenue is about 20.8 million KRW. Divided by 12, that is about 1.73 million KRW per month. After subtracting 3 million KRW of annual operating cost, annual net income is about 17.8 million KRW. Monthly net income is about 1.48 million KRW.
Annual generation = 100kW × 1,300kWh = 130,000kWh
SMP revenue = 130,000kWh × 90 KRW = 11,700,000 KRW
REC revenue = 130MWh × 70,000 KRW × 1.0 = 9,100,000 KRW
Annual gross revenue = 20,800,000 KRW
Annual net income = 20,800,000 KRW - 3,000,000 KRW = 17,800,000 KRW
Monthly net income = about 1,483,000 KRW
This is a sober starting point. It is less sweet than sales brochures, but better for decision-making. Farmland solar can take time because of permits and grid connection, so conservative numbers are safer at the beginning.
Mid-case: about 1.75 million KRW net per month
A mid-case assumption can use SMP at 110 KRW/kWh, REC at 75,000 KRW/MWh, and REC weighting at 1.0. In that case, annual gross revenue is about 24.05 million KRW. After subtracting 3 million KRW of operating cost, annual net income is about 21.05 million KRW. Monthly net income is about 1.75 million KRW.
SMP revenue = 130,000kWh × 110 KRW = 14,300,000 KRW
REC revenue = 130MWh × 75,000 KRW × 1.0 = 9,750,000 KRW
Annual gross revenue = 24,050,000 KRW
Annual net income = 21,050,000 KRW
Monthly net income = about 1,754,000 KRW
So the phrase “around 2 million KRW per month” is not completely wrong. But it is closer to gross revenue than true cash in hand. After operating costs, the number falls. After loan payments, it falls again.
Optimistic cases should not be treated as fixed income
If SMP is 125 KRW/kWh and REC is 80,000 KRW/MWh, annual gross revenue becomes about 26.65 million KRW. Even with operating cost raised to 3.5 million KRW, annual net income is about 23.15 million KRW. Monthly net income becomes about 1.93 million KRW.
SMP revenue = 130,000kWh × 125 KRW = 16,250,000 KRW
REC revenue = 130MWh × 80,000 KRW × 1.0 = 10,400,000 KRW
Annual gross revenue = 26,650,000 KRW
Annual net income = 23,150,000 KRW
Monthly net income = about 1,929,000 KRW
This is where the number begins to look attractive. But SMP and REC are not a fixed salary. Prices move. Revenue structure also changes depending on whether the project uses market sales or a fixed-price contract. A rosy calculation based only on a good spot-market month can become painful later. It is like building a warehouse based only on the best harvest year.
REC weighting changes the result quickly
REC weighting is often missed in farmland solar conversations. REC revenue is not only generation multiplied by REC price. Generation is multiplied by a weighting factor. That factor depends on site type, system size, policy rules, and project structure.
For example, if REC weighting is 1.2, SMP is 110 KRW/kWh, and REC is 75,000 KRW/MWh, annual gross revenue becomes about 26.0 million KRW. After subtracting 3 million KRW of operating cost, annual net income is about 23.0 million KRW. Monthly net income is about 1.92 million KRW.
SMP revenue = 14,300,000 KRW
REC revenue = 130MWh × 75,000 KRW × 1.2 = 11,700,000 KRW
Annual gross revenue = 26,000,000 KRW
Annual net income = 23,000,000 KRW
Monthly net income = about 1,917,000 KRW
That is why the question should not be “How much does 100kW make per month.” The better question is “Under what site type, REC weighting, sales method, and contract price does it make that amount.” One small assumption can change monthly profit.
Installation cost shows the payback period
Monthly income alone makes solar look easy. The problem is upfront capital. For a 100kW system, the payback period changes depending on whether total installed cost is 120 million, 150 million, 180 million, or 220 million KRW.
Using the conservative annual net income of 17.8 million KRW, simple payback looks like this.
- 120 million KRW installation cost: about 6.7 years.
- 150 million KRW installation cost: about 8.4 years.
- 180 million KRW installation cost: about 10.1 years.
- 220 million KRW installation cost: about 12.4 years.
Using the mid-case annual net income of 21.05 million KRW, the payback period becomes shorter.
- 120 million KRW installation cost: about 5.7 years.
- 150 million KRW installation cost: about 7.1 years.
- 180 million KRW installation cost: about 8.6 years.
- 220 million KRW installation cost: about 10.5 years.
These are simple payback numbers. They simplify taxes, loan interest, principal repayment, land rent, insurance, inverter replacement, module degradation, grid-connection burden, and accounting cost. A real project needs a second calculation using the actual quote and financing terms.
On farmland, permits come before profit
Before calculating revenue, the land itself must be checked. Is it in an Agricultural Promotion Area. Is it an agricultural protection zone. Is it ordinary farmland. The answer changes the route. A ground-mounted solar project may involve farmland conversion, development permits, power-generation business permits, and grid connection. Agrivoltaic projects may be reviewed under temporary alternative use of farmland when farming continues in substance.
The key point is simple. A profit spreadsheet does not replace a permit. Even if the calculation shows 1.8 million KRW per month, the project stops if grid access is blocked, development approval is difficult, or farmland conversion is not possible. So-called “absolute farmland” or agricultural promotion farmland needs special caution. Getting a contractor quote before local-government consultation is the wrong order.
For farmland solar, sequence matters more than excitement. First check the land. Second check grid connection. Third check permit feasibility. Fourth calculate profit. The calculator can wait until the ground rules are known.
Costs that reduce the monthly number
The 3 million KRW annual operating cost used above is a simplified number. Real sites may require inspection, vegetation control, cleaning, communications, insurance, safety management, inverter checks, monitoring, land rent, taxes, and accounting. When something breaks, parts and technician visits add cost.
Debt service is the other major item. If the project is fully self-funded, monthly net income is easier to understand. If the project uses debt, monthly cash flow can shrink sharply. For example, if monthly net income is 1.75 million KRW but loan repayment is 1.2 million KRW, cash left in hand is closer to 550,000 KRW.
So farmland solar should be judged by monthly cash flow, not monthly gross revenue. Gross revenue feels good. Cash flow keeps the business alive.
Landowners and tenants have different economics
A landowner and a tenant do not have the same solar economics. A landowner may not pay rent, but there is still an opportunity cost. The owner must consider farming loss, farmland-conversion issues, long-term land-use restrictions, and future land value.
A tenant should be more careful. If the lease term is shorter than the payback period, the project is risky. Solar is not a one- or two-year business. Lease duration, renewal rights, restoration, facility ownership, electricity-sales rights, and landlord consent should be written into the contract. A verbal “it should be fine” can change once money enters the site.
The core asset is not only the solar panel. The asset includes permits, grid access, contract duration, and land-use rights. If those four are weak, a beautiful spreadsheet is still weak.
100kW farmland solar checklist
Before moving forward, check these items.
- Whether the farmland is in an Agricultural Promotion Area.
- Whether farmland conversion or temporary alternative use can be reviewed.
- Whether the project is ground-mounted solar or agrivoltaic solar.
- KEPCO grid-connection feasibility and expected cost.
- Power-generation business permit, development permit, and electrical procedures.
- REC weighting and sales method.
- Conservative, mid, and optimistic SMP/REC scenarios.
- Whether the quote includes structures, inverter, civil work, electrical work, permits, and grid cost.
- Operating cost, insurance, vegetation control, cleaning, taxes, and accounting.
- Monthly cash flow after loan repayment.
- For leased farmland, lease term and restoration conditions.
If any of these are blank, the project is still in research mode. Solar earns money from sunlight, but many losses begin in documents.
So how much remains per month?
For a 100kW farmland solar system, a conservative case gives about 1.48 million KRW of monthly net income after basic operating cost. A mid-case gives about 1.75 million KRW. A favorable price case gives about 1.93 million KRW. These numbers do not yet subtract loan payments, taxes, land rent, extra grid cost, or future inverter replacement.
Still, 100kW is a useful reference size. It is not tiny, and not too large for a first calculation. It helps landowners understand generation, SMP, REC, and payback. But jumping in after hearing “2 million KRW per month” is risky. That number may be gross revenue, or it may depend on a specific REC weighting and market price.
The better question is not “How much does 100kW make.” The better question is this. On my land, under my permit conditions, with my grid cost and my financing terms, how much cash remains each month. That is where the real decision begins.
One-line summary
A 100kW farmland solar project may show about 1.48 million KRW in conservative monthly net income and about 1.75 million KRW in a mid-case, but permits, grid cost, loans, taxes, and land conditions must be included before calling it profit.
References
- Korea Power Exchange, public materials on SMP and the power market.
- Korea Energy Agency New and Renewable Energy Center, REC and RPS guidance materials.
- Korea Law Information Center,
Farmland ActArticle 36 and temporary alternative use of farmland. - Public explanations of SMP and REC revenue structures from Korean energy institutions.
- Korea Energy Economics Institute, research materials on agrivoltaic deployment and economics.
- IMUN.FARM existing posts on solar, agrivoltaic permitting, and profitability.