Imun Farmer · Published:
- 예상 수확: 10 min read
Agricultural Price Prediction: A Practical Guide Using KAMIS Data

Last year when onion prices nosedived, every group chat was saying the same thing.
“Planted based on last year’s prices, and look where that got us.”
The same old line.
Truth is, agricultural price prediction is already happening everywhere.
KAMIS, public wholesale markets, local governments, even private apps.
But when it comes to my own field, my own greenhouse — information that directly answers “what to plant, how much, and when to sell” — that’s hard to find.
Instead of showing off fancy AI models,
this article breaks down how to scrape KAMIS and wholesale market data to make practical “crop selection” and “shipping timing” decisions,
focused on real actions you can take.
1. Looking at “Patterns,” Not “Averages” with KAMIS Data
Let’s start with the KAMIS site.
Here are the URLs.
- KAMIS main: https://www.kamis.or.kr/customer/main/main.do
- Daily wholesale prices: https://www.kamis.or.kr/customer/price/bizcondition/catalogue.do?action=daily
- Quick price info (consumer prices/simple lookup): https://www.kamis.or.kr/customer/info/retail/period.do?action=daily
The basic structure of KAMIS data looks like this.
- Product category/subcategory codes (e.g., vegetables, onion, dried onion, etc.)
- Wholesale/retail classification
- Survey date
- Prices by quality grade (high/medium/low) or average price
- Survey region (wholesale market or consumer price reference area)
Here’s a common mistake.
“Last year’s average price was such-and-such.” And that’s where it ends.
Averages alone won’t help you pick the right crop or time your shipments.
1-1. Look at These 3 Things at Minimum
Pick a specific product (e.g., onions, garlic, cabbage) on KAMIS,
and download the last 3-5 years’ data to Excel.
At minimum, check these:
- Annual average wholesale price
- Monthly average wholesale price
- Annual/monthly peak and trough ranges
For onions, for example:
- Do prices drop when shipments pile up from May to July?
- How do prices spike when storage onions come out (winter to early spring)?
- Were there abnormal crashes or surges in specific years only?
Only then can you tell whether “last year was a special case” or “that’s the normal pattern.”
1-2. Avoiding “Price Valleys” with Moving Averages
No need to overcomplicate things in Excel.
- Sort daily price data chronologically
- Run 7-day, 14-day, and 30-day moving averages.
With moving averages,
- Days when supply got disrupted by sudden rain
- One-off spikes/drops from volume flooding a specific market
— this kind of noise gets cleaned up.
Looking at the moving average curve,
“Ah, this product bottoms out around the second week of June every year."
"It starts creeping up from the last week of October.”
— these patterns become visible.
Just doing this much
will help you largely avoid “mindlessly planting based on last year’s prices.”
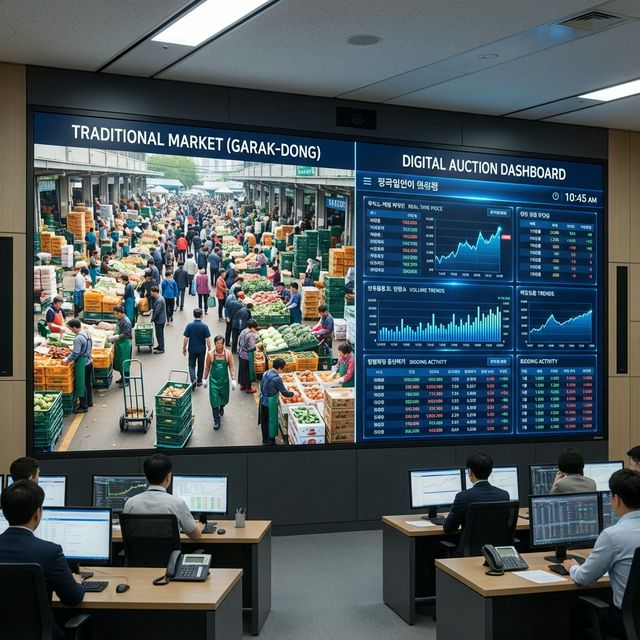
2. Wholesale Market Auction Data: Real On-the-Ground Prices
KAMIS is refined information, and slightly delayed.
Real on-the-ground data comes from public wholesale market auction records.
These datasets are available on the public data portal:
- National Agricultural, Marine & Livestock Wholesale Market Auction Price Standard Data
- https://www.data.go.kr/data/15029181/standard.do
- National Public Wholesale Market Real-time Auction Info OpenAPI
- https://www.data.go.kr/data/15141808/openapi.do
- Ministry of Agriculture Public Data Portal “Wholesale Market Real-time Auction Info”
This data contains fields like:
- Transaction date
- Wholesale market code/name (Garak, Busan, Daegu, Gwangju, etc.)
- Product code, variety code
- Grade
- Transaction weight (kg)
- Highest, lowest, and average prices, number of transactions
In a word, it tells you “how much actually traded at Garak Market today, and how many tons.”
Even without programming, there are options.
- Download the standard data as CSV from the public data portal
- Organize it monthly or quarterly and view it side by side with KAMIS data.
3. Patterns Already Validated in Research and Field Trials
”Price prediction” has already been tested in multiple places.
Among them, products like onions and garlic have quite a bit of research.
3-1. Onion Wholesale Price Prediction Paper Summary
Among papers from the Korea Information Processing Society ACK 2024:
- Title: Comparative Analysis of 12 Models’ Performance and Regional Results for Onion Wholesale Price Prediction
- Data used: KAMIS daily onion wholesale prices + weather data, etc.
- Models compared: Linear regression, Random Forest, XGBoost, LSTM, etc. — 12 total
Key takeaways:
- Even simple models (linear regression, moving averages) are “plenty useful for avoiding disasters.”
- Regional supply-demand structures differ, so even the same model shows large performance gaps across regions.
- Overly complex deep learning models actually become unstable when data volume is insufficient.
The bottom line: starting with simple models tailored to “our area, our crop” is better.
3-2. Government and Public AI Prediction Services
Looking at the Ministry of Agriculture’s public data use cases,
AI-based price prediction services combining KAMIS, public wholesale market, and weather data are being developed.
- Agricultural price prediction web/mobile services: KAMIS + KOSIS + weather data integration
- 1-week to 1-month predictions for specific products (onions, garlic, cabbage, etc.)
Also, some municipalities like Gyeongsangnam-do
have run pilot projects “using AI and big data to predict garlic and onion prices,”
sending farmers price forecasts via text or app alerts.
Common features of these services:
- They combine KAMIS long-term time series + wholesale auction data + weather/cultivation area data to build models
- They deliver simple messages to farmers like “this month’s onion prices are expected to be 20% below the normal year.”
What we as individual farmers should do
is reference “what data combinations these services use for prediction”
and replicate similar combinations in our own spreadsheets or simple code.
4. How to Actually Use It: Crop and Shipping Timing Decisions
Now for the most important part.
Not “browsing” data but using it for “decisions.”
4-1. Crop Selection: “Should I Plant More Onions This Year or Not?”
Let’s use a hypothetical example.
- My field: 2,000 pyeong
- Candidate crops: Onions vs. Garlic
- Dilemma: “Should I expand onions this year, or garlic?”
Steps:
- Download monthly wholesale price data for onions and garlic for the last 5 years from KAMIS.
- Organize annual averages, monthly averages, and peak/trough prices.
- Extract garlic and onion auction average prices from Garak Market data.
- Conservatively estimate expected yields (kg/pyeong) for your field.
- Run a simple prediction model, or at minimum, calculate “normal year range” and “worst-case scenario” separately.
For example:
- Onion normal year wholesale price: 800 KRW/kg
- Worst year wholesale price: 400 KRW/kg
- My yield: 2,000 pyeong × 400 kg/pyeong = 800,000 kg (example — actual yields vary greatly by variety and method)
- Average scenario revenue: 800,000 kg × 800 KRW = 640 million KRW
- Worst scenario revenue: 800,000 kg × 400 KRW = 320 million KRW
Calculate garlic the same way:
- Average scenario revenue
- Worst scenario revenue
- Compare the money remaining after subtracting production costs (seeds, supplies, labor, storage).
The key point here is
“Don’t judge by averages alone — look at whether you can survive the worst 1-2 years out of X.”
Using data means asking these questions:
- “Are onion prices already in a low zone relative to historical norms?"
- "Is garlic actually in the danger zone right now?“
4-2. Shipping Timing: “Move Up 3 Days or Delay 1 Week?”
Shipping timing requires more precision.
Wholesale market auction data really shines here.
- Pull Garak Market onion auction average prices by date for February-April over the last 5 years.
- Mark the “local peak periods” and “trough periods” for each year.
- Calculate 7-day and 14-day moving averages to see gradual rise/fall zones.
This might reveal patterns like:
- Many years show prices rising in the 2 weeks before Lunar New Year.
- After mid-March, volume increases and prices gradually decline.
Then actual decision-making shifts to:
- “This year storage quality is decent, and the market seems to be following the normal year pattern."
- "Let’s start shipping 10 days before the holiday and aim for peak 3-4 days before.”
Conversely:
- If production-area volume is already flooding the market,
- And the auction average is tracking below the normal year curve,
you can shift your judgment toward “stop being greedy and sell quickly.”
This doesn’t require advanced AI.
Just plotting “normal year curve vs. this year’s curve” side by side is enough.
5. How Complex a Model Do You Really Need?
Now a bit on AI.
Looking at papers and actual services, we can roughly divide it into three tiers.
Tier 1: Statistics/Excel level
- Moving averages, seasonality (monthly/quarterly pattern) analysis
- Average, worst, best scenario simulations
- For crop selection/shipping timing decisions, this level is quite useful.
Tier 2: Simple regression/tree models
- Input: KAMIS prices, wholesale auction prices, weather data, cultivation area, etc.
- Output: 7-day, 30-day price predictions
- Advantage: Explanatory power — you can roughly see which factors influence prices.
Tier 3: Deep learning/time-series specialized models (LSTM, Transformer, etc.)
- Advantage: Can capture more complex patterns.
- Disadvantage: Becomes unstable without sufficient data, and burdensome for farms to operate directly.
Even in the onion wholesale price prediction paper,
results showed “making the model more complex doesn’t automatically make it better.”
And most government/public services operate at “not too complex” levels.
So for individual farms or small teams, think of it this way:
- Nail down Tier 1 solidly
- If needed, apply Tier 2 to gauge “how much prices might deviate from normal.”
6. Data Limitations and Pitfalls
Not all data should be trusted blindly.
KAMIS and wholesale market data have several limitations.
6-1. KAMIS’s Structural Limitations
- Survey frequency and standards: Consumer prices are sampled from selected supermarkets and traditional markets.
- Holidays and weekends can create survey gaps or outliers.
- Product/grade categories may not perfectly match reality.
Also, KAMIS includes processed food retail price information.
- Example: Prices of processed foods like ramen, cooking oil
This is more useful for understanding “consumer-perceived price levels” than for direct crop selection.
6-2. Wholesale Market Data Limitations
- Specific market bias: Looking only at Garak Market can distort regional supply-demand pictures.
- Products/varieties with low trading volumes can show exaggerated price volatility.
- Real-time auction info APIs can go down or experience delays.
So in practice, you need this checklist:
- Look at minimum 3 years, preferably 5+ years of data.
- View at least 2 types of data together: KAMIS + wholesale market.
- For years that deviate significantly from normal patterns, check the news to understand why.
- Even if your model says “prices will boom this year,” separately calculate production costs and worst-case scenarios.
This much alone can largely avoid the “blind data trust” pitfall.
7. A Realistic Usage Scenario for an Individual Farm
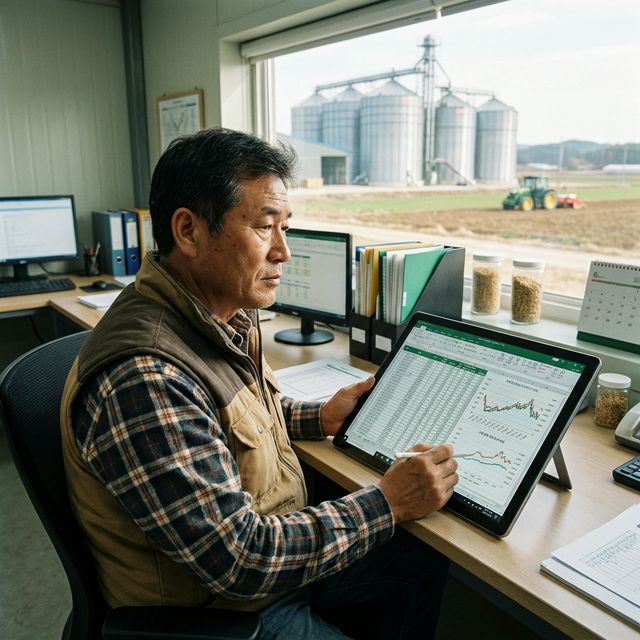
Finally, imagine using this as an individual farmer.
This is for a typical small-scale field farming operation.
- Download monthly wholesale prices for 4 products — onion, garlic, cabbage, green onion — from KAMIS for the last 5 years.
- From public wholesale market auction data, organize annual/monthly average auction prices for 2 markets (Garak and Busan).
- Record your local wholesale market’s actual prices (NongHyup, nearby intermediary trader prices) for at least 1 year.
- In Excel, create:
- Moving averages (7-day, 30-day)
- Monthly seasonal patterns
- Normal year vs. this year curve comparisons
- For crop selection:
- Calculate average scenario vs. worst scenario net profit,
- First check “can I survive the loss in a worst year?”
- For shipping timing:
- Mark peak/trough zones from normal-year patterns
- Update this year’s auction curve weekly, just checking “where is today relative to the normal year?”
This much, without any fancy AI,
gets you a move or two ahead of “planting the same as last year based on last year’s prices.”
Data is ultimately a tool.
You can build a house with just a hammer.
But sketching out where and how to drive the nails beforehand — that’s what data is for.
#AgriculturalPricePrediction #KAMIS #WholesaleMarket #FarmingDecisions #SmartFarm #DataAgriculture
References
- Korea Agricultural Marketing Information Service (KAMIS) main page, price
information service structure and product/wholesale/retail data delivery explanation
- KAMIS daily wholesale price lookup page, daily wholesale price lookup and Excel
download functionality
- KAMIS key agricultural product daily wholesale prices (Garak Market, etc.) page,
market/product price information examples
- KAMIS quick price information (consumer prices) page, period/product simple
lookup functionality
- Korea Agro-Fisheries & Food Trade Corporation (aT) processed food retail price information dataset, retail price information linked to KAMIS service
- Public Data Portal National Agricultural/Marine/Livestock Wholesale Market Auction Price Standard Data, product/variety/grade daily auction price and trading volume field definitions
- Ministry of Agriculture/aT National Public Wholesale Market Real-time Auction Info OpenAPI, real-time auction price and transaction information
- Ministry of Agriculture Public Data Portal “Wholesale Market Real-time Auction Info” service description, wholesale market transaction information structure and usage guide
- Ministry of Agriculture Public Data Portal data use cases: agricultural price prediction service built using KAMIS and public data
- ”Comparative Analysis of 12 Models’ Performance and Regional Results for Onion Wholesale Price Prediction,” KIPS ACK 2024 Conference Paper, KAMIS data and 12 prediction model comparison
- ”Using AI and Big Data to Predict Garlic and Onion Prices” video report, government/public sector AI price prediction project case
Contribution to this Harvest
내용이 유익했다면 물을 주어 글을 성장시켜주세요!
(0개의 물방울이 모였습니다)